15 years since the very first Zero Waste City established itself in Capannori, Italy, Zero Waste Europe is proud to present its biggest analysis of the data we receive from the Zero Waste Cities we work with across Europe.
Within both the Zero Waste Cities programme by ZWE and the Zero Waste Cities Certification by MiZA, as of 1st January 2022 we collectively work with 462 cities who have committed to become zero waste – with this number rising every month. We have Zero Waste Cities in 11 European countries:
- 326 in Italy
- 92 in Spain
- 19 in Croatia
- 16 in Slovenia
- 12 in Romania
- 2 in Ukraine
- 1 in Germany, Belgium, Latvia, Bulgaria and the UK.
In the next couple of months, we hope and expect to see formal zero waste commitments with us from big cities in Germany like Munich and Cologne, as well as the first zero waste city in a number of new countries, ranging from Cyprus to Slovakia, Greece to the Czech Republic.
Within our Zero Waste Cities programme and the MiZA Zero Waste Cities Certification, we work with both Europe’s best performing municipalities and those who are just starting out on their journey towards zero waste. For example, separate collection rates range from 7% to the highest of 93% (Arcade Treviso in Italy). However, we can see a direct positive impact from our zero waste cities, who on average separate collect 67% of municipal solid waste (MSW). With an average loss rate of 5-10%, we can confidently say that our Zero Waste Cities prove a methodology for achieving the EU’s recycling target of 55% for 2025.
Going beyond this, looking at the data from our Zero Waste Cities, we can see that an average of 438kg per capita was produced in the latest year of reporting. With the EU average for 2020 being 503kgs, we can prove the impact that our work is having – on average, our Zero Waste Cities produce 65kgs less waste per person per year than the European Union average.
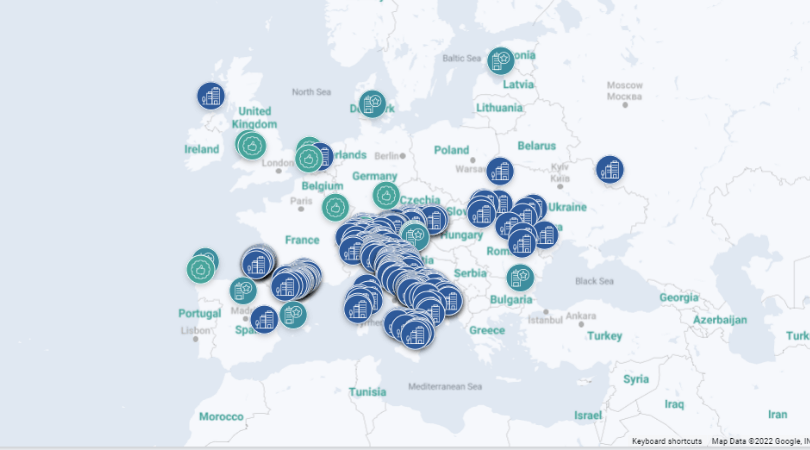
With our new online map, you can access some key data for each of our zero waste cities, but you can also see best practices of zero waste implementation that exist outside of our zero waste cities. The data available for each zero waste city includes the population, total MSW generated per capita and separate collection rate, both of which you can compare against the national average. Further to this, we have calculated the residual waste generated per capita for each city, with the important caveat that these are only approximate figures, not official ones, as they do not count for the loss of recyclable materials that are collected but still end up as residual waste due to high levels of contamination and other factors.
When comparing the total municipal solid waste generated per capita between city to city, it is again important to view these figures with some nuance and further understanding. Gathering total MSW figures in Europe means comparing figures that are calculated in different ways – for example some countries report construction waste within their MSW totals whilst others don’t. Yet we decided to publish total MSW figures as we believe it is important to use this indicator, recognizing the limitations of collection and recycling. Given the urgency of today’s environmental crises, we must dramatically start reducing our overall consumption, through greater uptake in reuse and repair initiatives, as well as simply consuming less items in the first place. Hence, why we have published total MSW figures with this map, as we believe residual waste generation does not tell the full picture.
The map also allows you to navigate through some examples of zero waste practices and solutions implemented by municipalities across Europe, irrespective of whether they are part of the zero waste city programme. These range from initiatives taken by large, highly-populated municipalities as well as those on the small scale, and can serve as inspiration for other municipalities wanting to start, or expand their transition to zero waste.
We hope that you find our new online map a useful resource and tool for your work. We believe that openly publishing data is critical in helping build knowledge, understanding and capacity for local actors to accelerate the transition to zero waste. We know that too often the data surrounding waste generation and recycling cannot be 100% verified as accurate or compared equally across countries, due to different calculation mechanisms. Yet it is clear that, whether just starting out or well advanced on the path towards zero waste, our Zero Waste Cities model provides municipalities with a proven framework to reduce their waste, increase recycling and save costs all at the same time.